How to remove Advanced Mac Cleaner virus from Mac

When the application called Advanced Mac Cleaner gains a foothold on a macOS machine, it attempts to throw the user off their routine trail by reporting numerous problems with the system. At that point, the admin is usually wondering how on earth this program installed itself on their computer in the first place. That’s where the fundamental difference lies between PUAs (potentially unwanted applications) and regular system optimization tools: the former come unannounced. The software under scrutiny is making the rounds via bundling, where its installer clings to the setup clients for other utilities – benign ones – in such a way that whoever is performing the install isn’t notified of the extra component. As a result, the app slithers its way inside without being clearly authorized by the user.

Advanced Mac Cleaner GUI

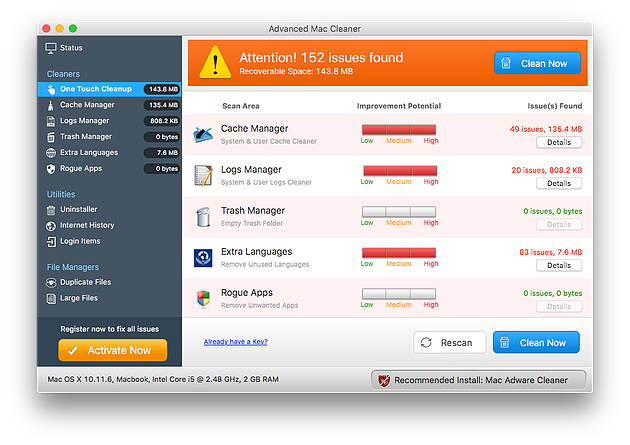
Another thing that makes Advanced Mac Cleaner an unwelcome guest is its obtrusive nature. When operating inside a Mac, it signals its presence by running system scans off and on and displaying scan reports that cannot possibly leave the victim indifferent. It claims to detect hundreds or even thousands of issues which it flags critical. These purported bugs include cache redundancy, unsafe logs, rogue apps, too much memory occupied by unused languages, and the like. The eye-catching red warning bar at the top of its main pane is intended to put additional pressure on the user. So are the popup alerts that reiterate the warning message and strongly recommend starting repair of the system.

What is the point of this activity? It’s quite prosaic: the culprit tries to convince the user into purchasing its full version. It states that doing so is the only way to fix all of the alleged problems. If the victim lingers with their decision, Advanced Mac Cleaner virus will flood the system with a growing number of warning dialogs that end up too annoying to endure. Another likely upshot of this attack is Mac performance deterioration as the scareware uses a great deal of CPU, perhaps deliberately in a bid to make the doom and gloom yet gloomier. Things continue to get out of hand until the computer turns into a primitive generator of noxious popups and becomes a nuisance to use. Follow the steps below to break free from this nasty cyber quagmire and uninstall Advanced Mac Cleaner from an infected Mac.

Remove Advanced Mac Cleaner virus manually

This section covers an effective way of uninstalling this potentially unwanted application from an infected macOS-based machine. Here’s what you need to do: Continue reading How to remove Advanced Mac Cleaner virus from Mac

Using the View Hierarchy and Console for easier debugging

At some point in life, you are gonna work with a codebase that you didn’t write from the very beginning. Specially if you are maintaing it, one of the biggest questions often is ‘where to start looking in order to fix bug Y?’.

Most of the times, there will be a strong relationship with what you see in the screen and the code you need to get fixed. For those cases, I’ve wrote three strategies that involve the Xcode’s ‘view hierarchy debug’ and the console. I’ve used them often and they have proved handy, so I hope they can be of help for you.

For this guide I’m using Xcode’s view hierarchy debug, a knock-off of an original app, Reveal. If you haven’t tried it, I really recomend that you download Reveal’s trial and that you ask your company / boss / parents to buy it since it makes debugging so much less painful.

1. Find the delegate and dataSource of a UITableView

  1. Get the memory address of the UITableView you want to debug. If you are using the debug view hierarchy tool from Xcode, you will find the address on the top of the Object Inspector: Memory Address of the cell in the object inspector 
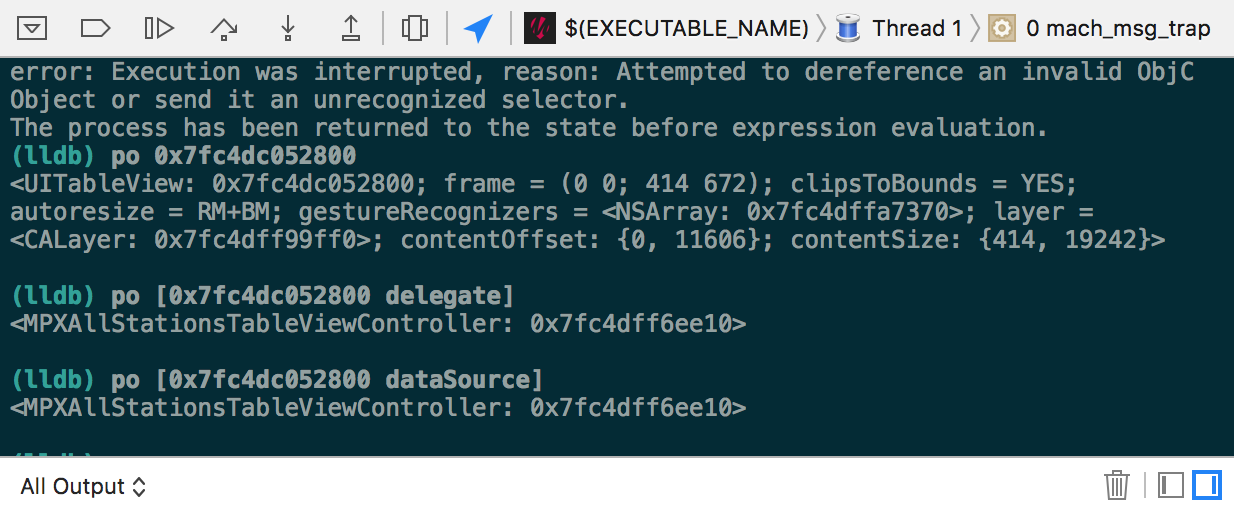
In this example, we observe the address 0x7fc4ddf403c0 for the UITableView.
  2. Knowing this address we can simply print its delegate or dataSource in Xcode’s Terminal:
    po [0x7fc4ddf403c0 delegate]
    

    Memory address and class of the UITableView's delegate

    Aha! We got the delegate and datasource for this UITableView and we know where we need to start adding breakpoints!

2. Find the dataSource and delegate of a UICollectionViewCell

If you can get the memory address of a UICollectionViewCell, you can get its UICollectionView and then find its dataSource and delegate.

  1. Start by finding the address of the UICollectionViewCell by using the debug view hierarcy tool. In this example 0x7f83068767f0.
  2. Then, look for the nextResponder of it.
    po [0x7f83068767f0 nextResponder]
    

    UICollectionView print

  3. With the address of the UICollectionView now we simply print its dataSource and delegate like we did for the UITableView.
    po [[0x7f83068767f0 nextResponder] dataSource]
    

    UICollectionView delegate print

3. Find the method called by a UIButton (or UIControl)

The ‘Debug View Hierarcy’ in Xcode, can tell us the class name of a button’s target. This is very helpful, but perhaps you really want to nail down the name of the method that is being called when you press that button.

  1. First, get the memory address of the UIButton (or UIControl) you want to debug.
  2. Then, print the targets of the button.
    po [0x7fc3277025d0 allTargets]
    

    This will print all the targets of your UIControl with their memory addresses.

    Memory addresses and class of the button's targets

  3. We got the target of this UIControl, now we can get the selector being called during the control event. Here I’m looking for UIControlEventTouchUpInside. Enum values are not defined in the console so we will need to use the actual numeric value for UIControlEventTouchUpInside, 64.
    po [0x7fc3277025d0 actionsForTarget:0x7fc322e99070 forControlEvent:64]
    

    This command will print an array with selector(s) we are looking for. In this example, the selectors for the event userDidTouchUpInsideFeedbackButton in the button.

    Selectors for `userDidTouchUpInsideFeedbackButton`

    Now we narrowed the event of this control down to the method and class.

Happy debugging!

Using a hardware controller for your debugger

Back when I was active recording my own music (SoundCloud for the curious) I always used a hardware knob to navigate and control Logic.

It was a very simple device (a knob which is also a big button) but incredibly useful. So I thought: if it was so wonderful with music software, perhaps it can useful on an IDE!

My main problem was the constant switching between clicking the simulator (or taping a real device) and typing the common two-handed shortcuts you need while debugging in Xcode: pause, step over, step into, etc.

Controller Options

I browsed MIDI controllers and video control surfaces, and bought a Contour Shuttle-Xpress after a little research. It’s small, inexpensive and comes with a dial and more than enough buttons.

Shuttle-Xpress

Other options I considered were:

  • an updated version of the Griffin Powermate: It looks really neat but I wanted more than one button. Also, I’m not a big fan of changing batteries.
  • Palette Controllers: Nice looking but too expensive. If you don’t know what to do with your money, there is a Wood Edition for only $899.
  • MIDI controllers: Bulky and require some third party software converting MIDI to keyboard commands.

Layout

Next thing was just to configure my most used shortcuts and tune a little bit that configuration after some use. This is the layout I’m using right now:

Button Action
Big Left Button De / Activate Breakpoints
Left Button Add Breakpoint at Current Line
Central Button Debug – Pause
Right Button Debug – Continue
Big Right Button Debug – Step Into
Jog Wheel Up Arrow / Down Arrow
Springy Wheel Debug Step Over / Out

Results

Definitively worth it!

It’s probably not as powerful as it is for video or music software, but it makes debugging more comfortable, and at 40-60 USD it’s worth a try.

Of course, you could also set different shortcuts, but the easy ones are already assigned, and if I really wanted to stretch my hands I would instead try to play something from Rachmaninoff.

Happy debugging!