At some point in life, you are gonna work with a codebase that you didn’t write from the very beginning. Specially if you are maintaing it, one of the biggest questions often is ‘where to start looking in order to fix bug Y?’.
Most of the times, there will be a strong relationship with what you see in the screen and the code you need to get fixed. For those cases, I’ve wrote three strategies that involve the Xcode’s ‘view hierarchy debug’ and the console. I’ve used them often and they have proved handy, so I hope they can be of help for you.
For this guide I’m using Xcode’s view hierarchy debug, a knock-off of an original app, Reveal. If you haven’t tried it, I really recomend that you download Reveal’s trial and that you ask your company / boss / parents to buy it since it makes debugging so much less painful.
1. Find the delegate and dataSource of a UITableView
- Get the memory address of the
UITableViewyou want to debug. If you are using the debug view hierarchy tool from Xcode, you will find the address on the top of the Object Inspector: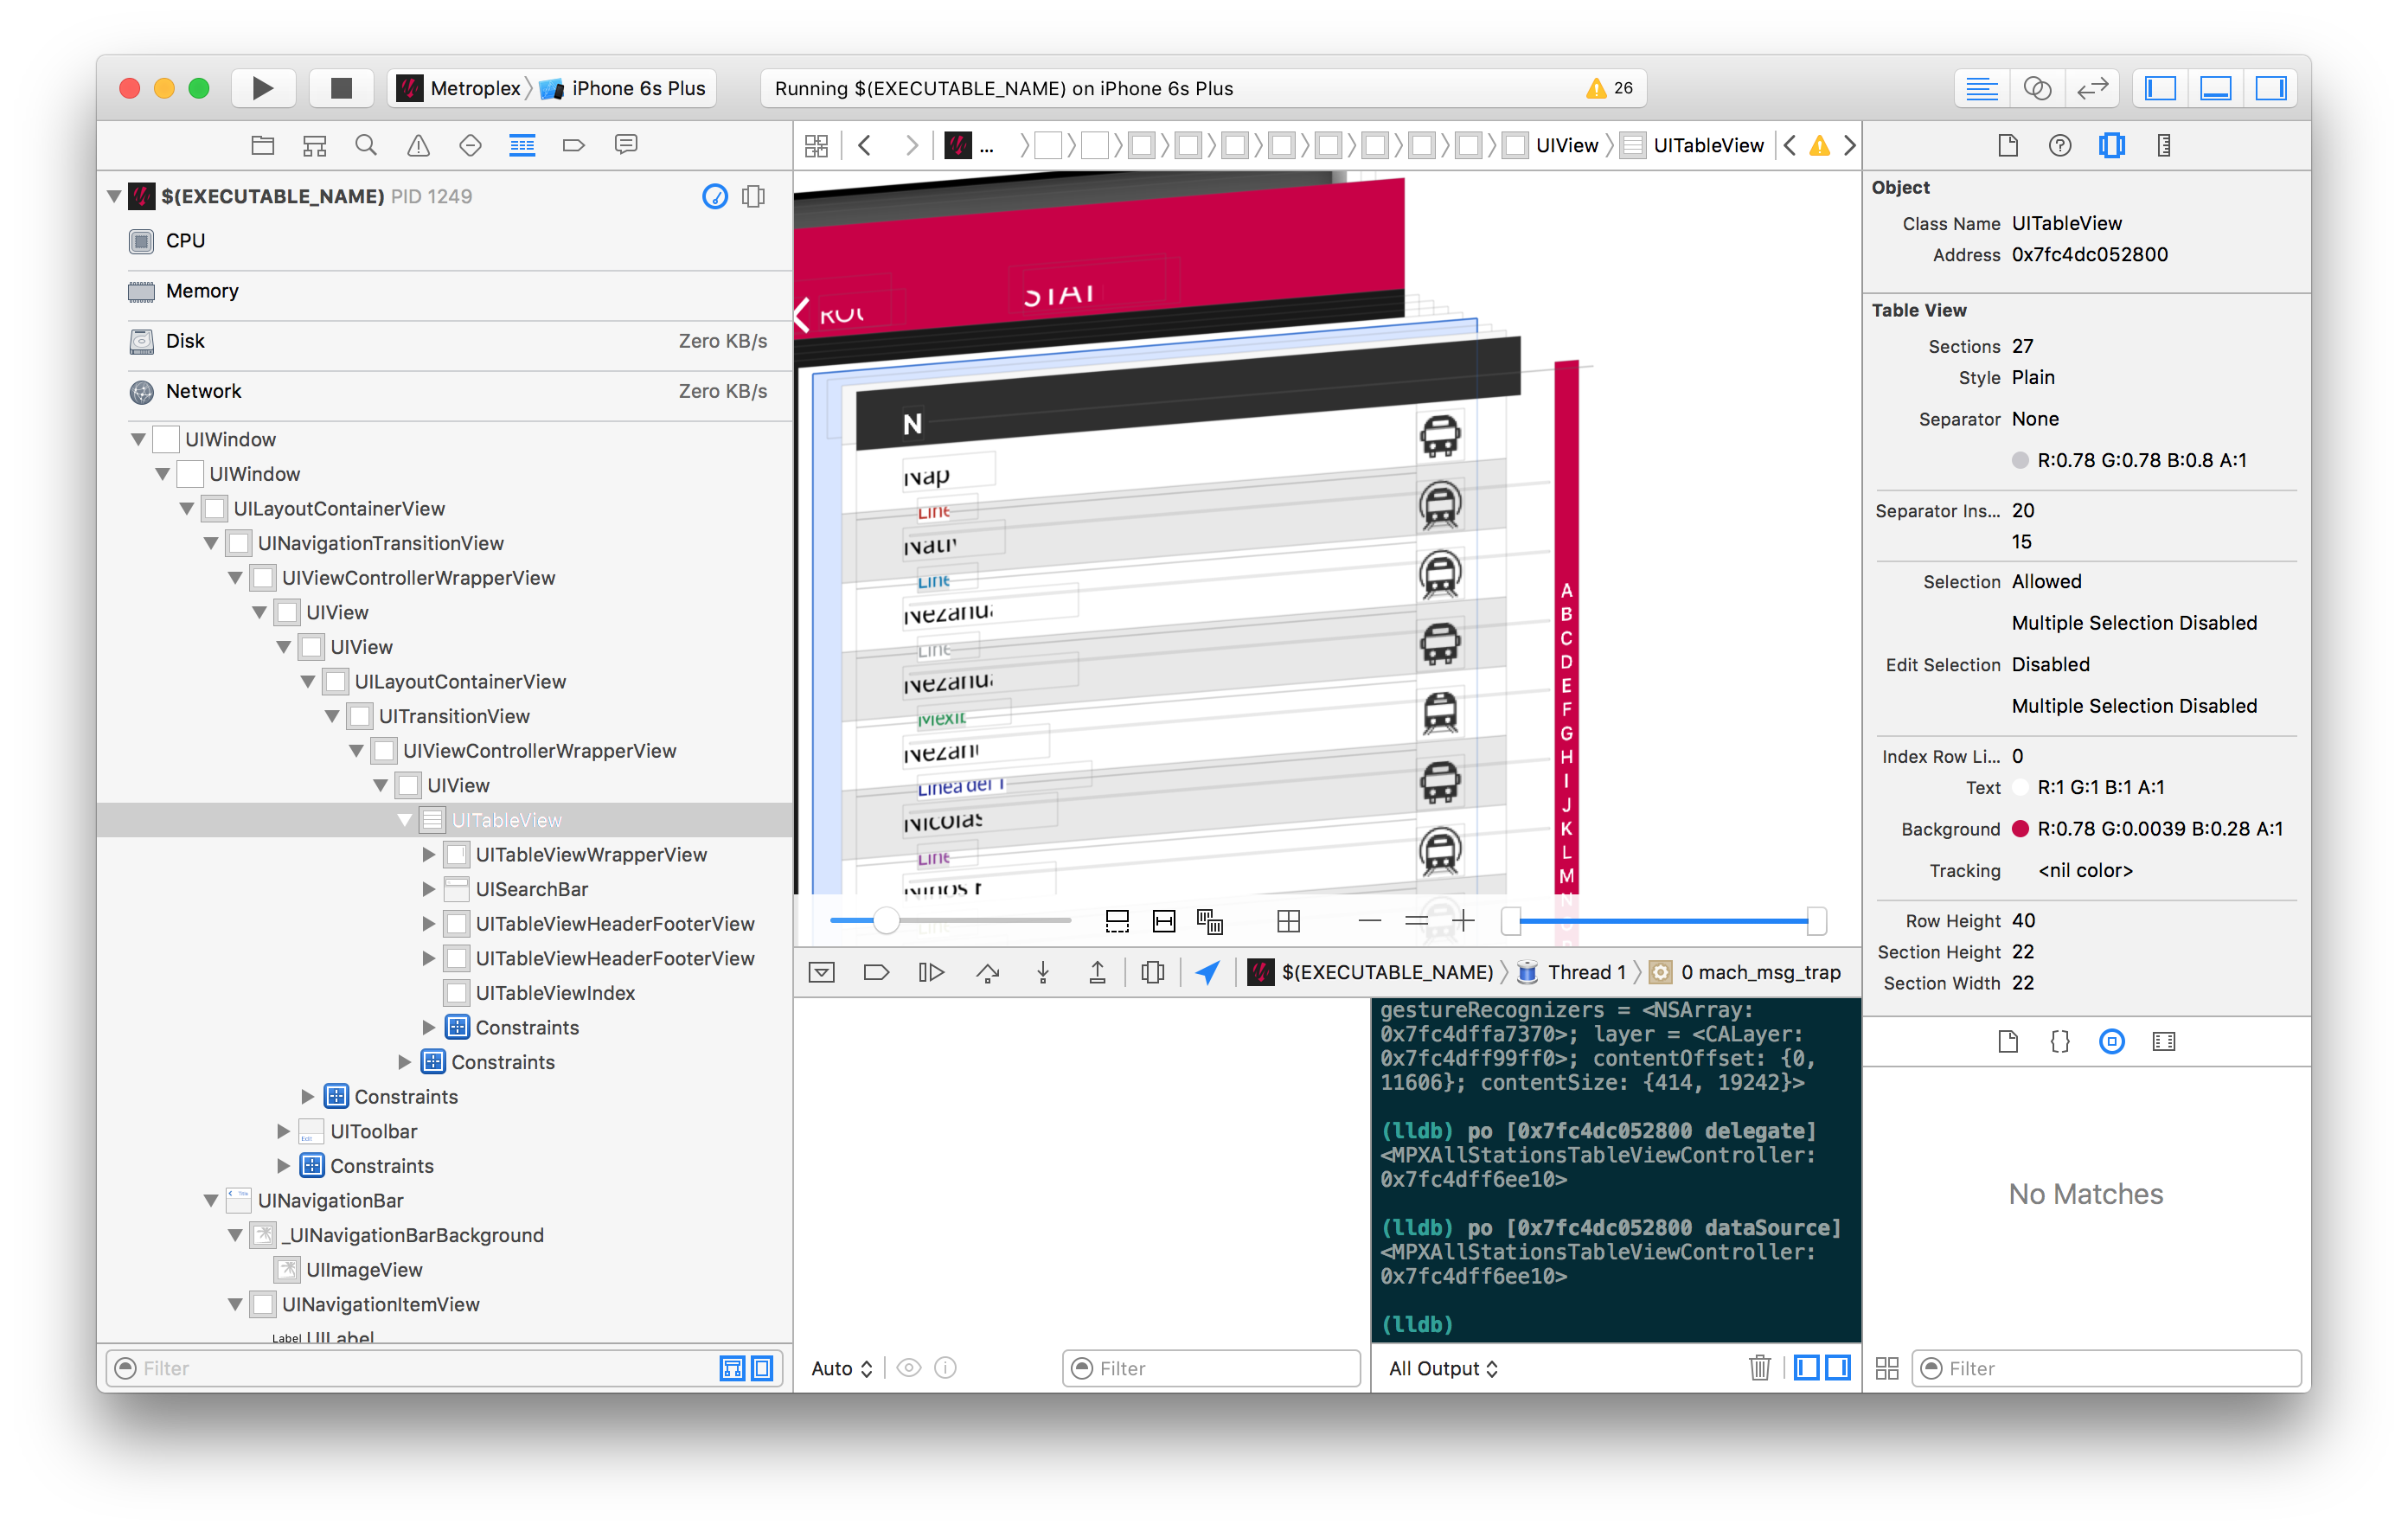 In this example, we observe the address 0x7fc4ddf403c0 for the
 UITableView. - Knowing this address we can simply print its
delegateordataSourcein Xcode’s Terminal:po [0x7fc4ddf403c0 delegate]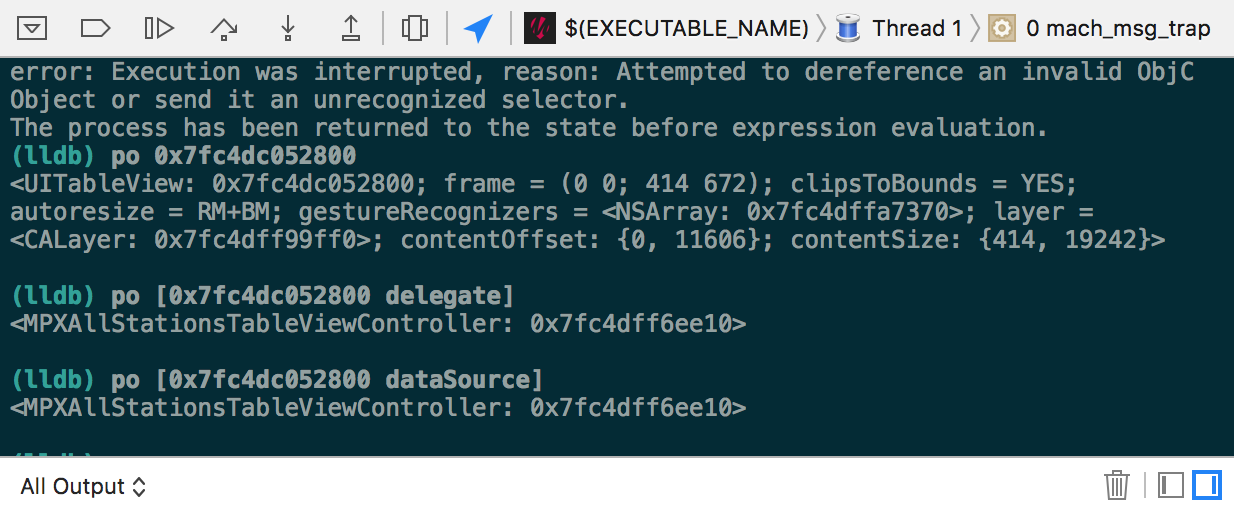
Aha! We got the
delegateanddatasourcefor thisUITableViewand we know where we need to start adding breakpoints!
2. Find the dataSource and delegate of a UICollectionViewCell
If you can get the memory address of a UICollectionViewCell, you can get its UICollectionView and then find its dataSource and delegate.
- Start by finding the address of the
UICollectionViewCellby using the debug view hierarcy tool. In this example 0x7f83068767f0. - Then, look for the
nextResponderof it.po [0x7f83068767f0 nextResponder]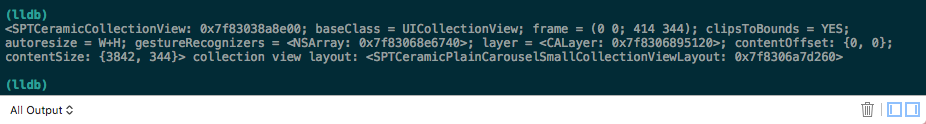
- With the address of the
UICollectionViewnow we simply print itsdataSourceanddelegatelike we did for theUITableView.po [[0x7f83068767f0 nextResponder] dataSource]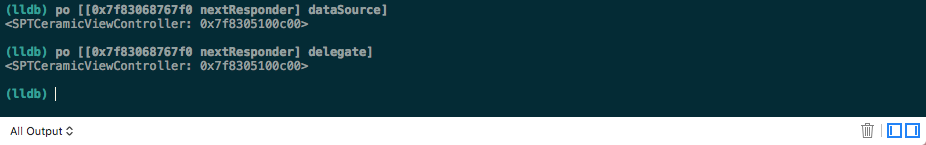
3. Find the method called by a UIButton (or UIControl)
The ‘Debug View Hierarcy’ in Xcode, can tell us the class name of a button’s target. This is very helpful, but perhaps you really want to nail down the name of the method that is being called when you press that button.
- First, get the memory address of the
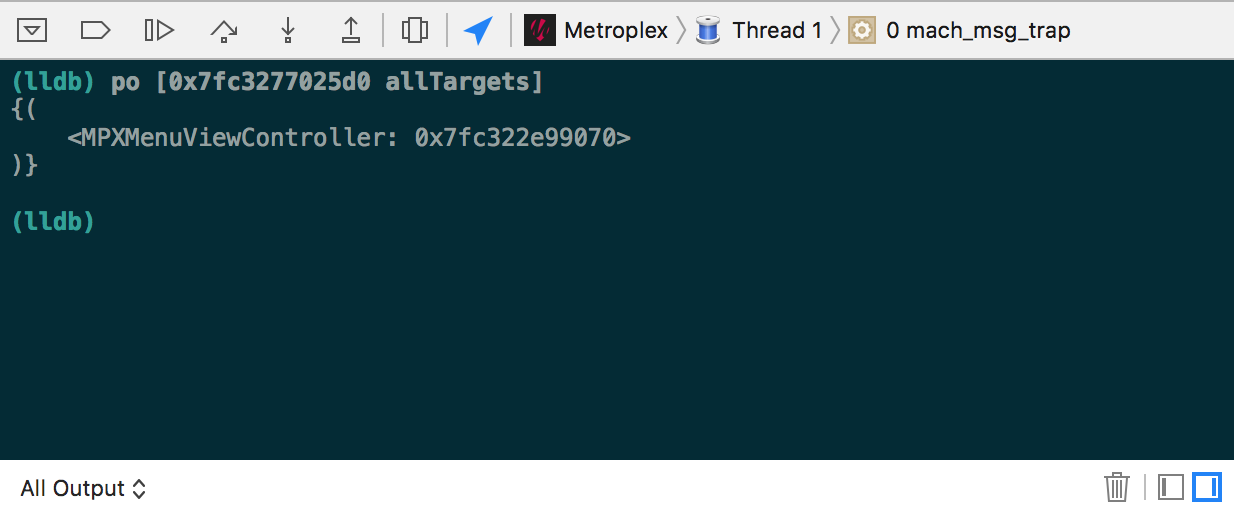
UIButton(orUIControl) you want to debug. - Then, print the targets of the button.
po [0x7fc3277025d0 allTargets]This will print all the targets of your UIControl with their memory addresses.
- We got the target of this
UIControl, now we can get the selector being called during the control event. Here I’m looking forUIControlEventTouchUpInside. Enum values are not defined in the console so we will need to use the actual numeric value for UIControlEventTouchUpInside, 64.po [0x7fc3277025d0 actionsForTarget:0x7fc322e99070 forControlEvent:64]This command will print an array with selector(s) we are looking for. In this example, the selectors for the event
userDidTouchUpInsideFeedbackButtonin the button.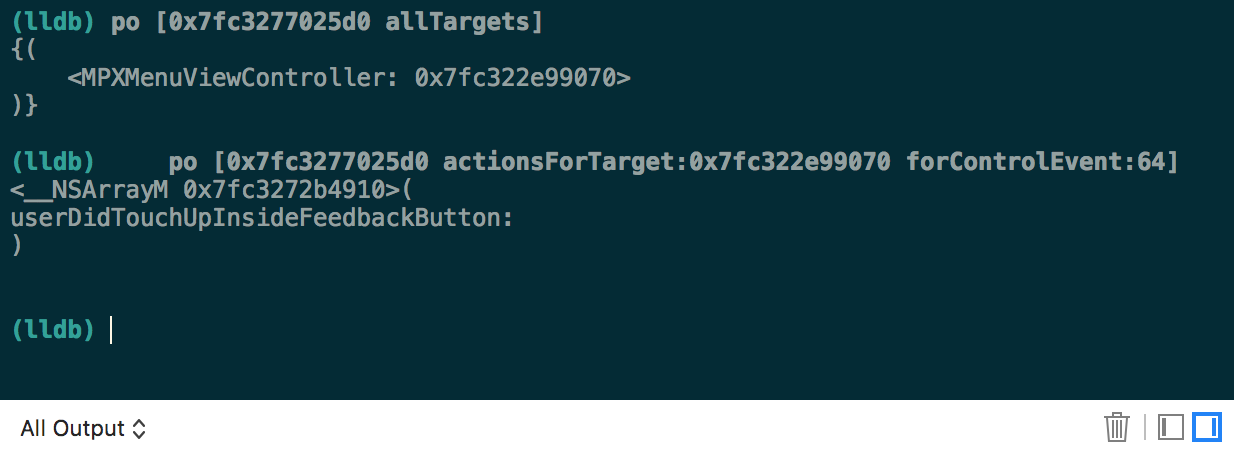
Now we narrowed the event of this control down to the method and class.
Happy debugging!